
One metric, several values
Finance, sales and operations use different formulas, periods or levels of detail for a metric with the same name.
We establish metric definitions, sources, owners, reference data and quality controls, ensuring traceability from a consolidated result back to the underlying transaction, cause and accountable person.
Discuss your needs →Finance, sales and operations use different formulas, periods or levels of detail for a metric with the same name.
Regular reporting requires exports, spreadsheets, adjustments and the knowledge of individual analysts.
The number of dashboards grows, while managers still need to confirm calculation methods and data sources.
Updating the system, status or processing rules affects the indicator without established control and approval.
The same metric may be calculated differently in financial, commercial and production reports. Accounting balances may differ from warehouse records, while the order portfolio may depend on which statuses an analyst selects.
Management meetings often spend much of their time reconciling source data and calculation methods. Managers debate which figure is correct instead of examining the cause of a variance and deciding what to do.
This practice establishes shared metric definitions, data lineage, ownership and quality rules, so consolidated results can be traced back to underlying records and the accountable person.
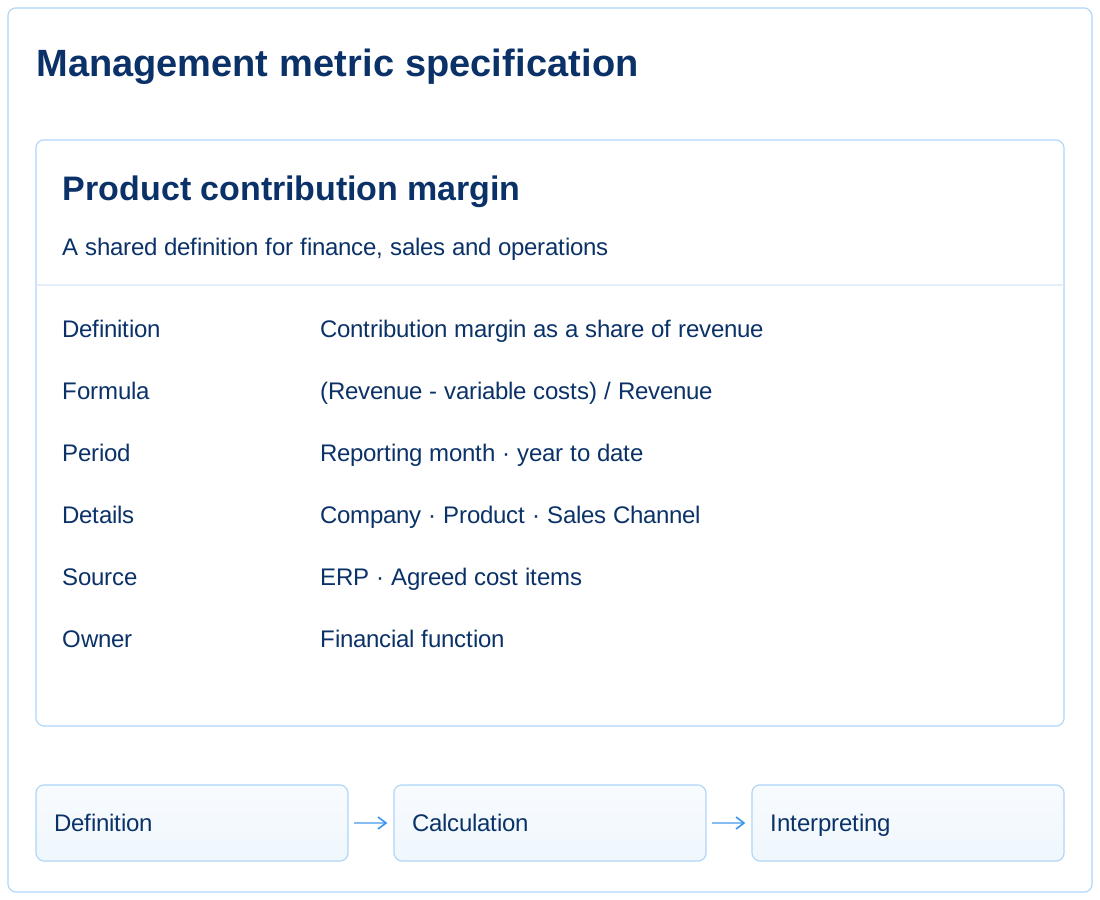
Each metric has a defined meaning, formula, period, analytical dimensions, level of detail and scope of use.
Name, definition, formula, units of measurement, period and detail.
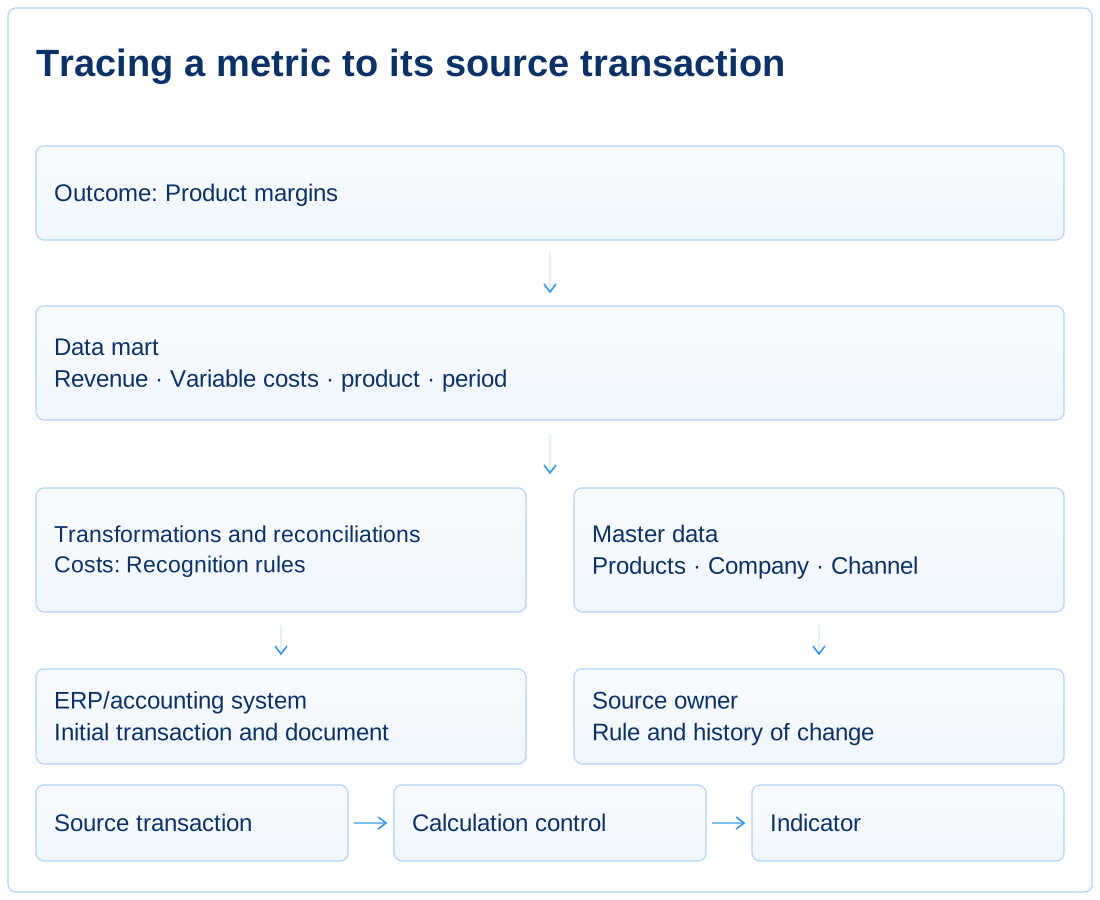
The path from the initial operation through sources, transformations, reconciliations and consolidation rules to the final presentation is fixed.
Source system, transformations, control points, and history of change.
For the indicator and primary data, owners, quality rules, correction procedure and action in case of variance are fixed.
The owner of the indicator, the data owner, the quality criteria and the deadline for eliminating the error.
A single version of the truth does not necessarily require one database. It requires a shared definition of each metric, a traceable calculation path and clear accountability for source data quality.
The indicator becomes manageable when the manager understands what it means, where it came from, and who should act in case of variance.
We start with the questions management needs to answer, agree a metric model, establish data lineage and quality controls, and then embed analytics in the regular decision-making cycle.
Determine what decisions are made by the owner, board of directors, CEO and functional managers and what data is needed for each level.
Reporting follows available data and system capabilities rather than specific management questions.
We record decisions, indicators, the necessary detail, the frequency of updating, the permissible variance and the action of the head.
Each report has a clear management question, user and action to take when a variance arises.
One name corresponds to one definition, one formula and established detail.
Functions use different formulas, periods and analytical dimensions for metrics with identical names.
We create a dictionary of indicators, fix definitions, formulas, periods, details, owners and relationships between indicators.
Finance, operations and sales obtain the same result from agreed source data.
The path of the indicator is traced from the final presentation to the initial operation.
The method of reconciliation and transformation is known to individual analysts, and errors are compensated by manual adjustment of the report.
We document source systems, transformations, reference data, checkpoints and checks for completeness, timeliness and consistency.
For variance or error, the place of origin, the owner of the original data and the deadline for eliminating the root cause are visible.
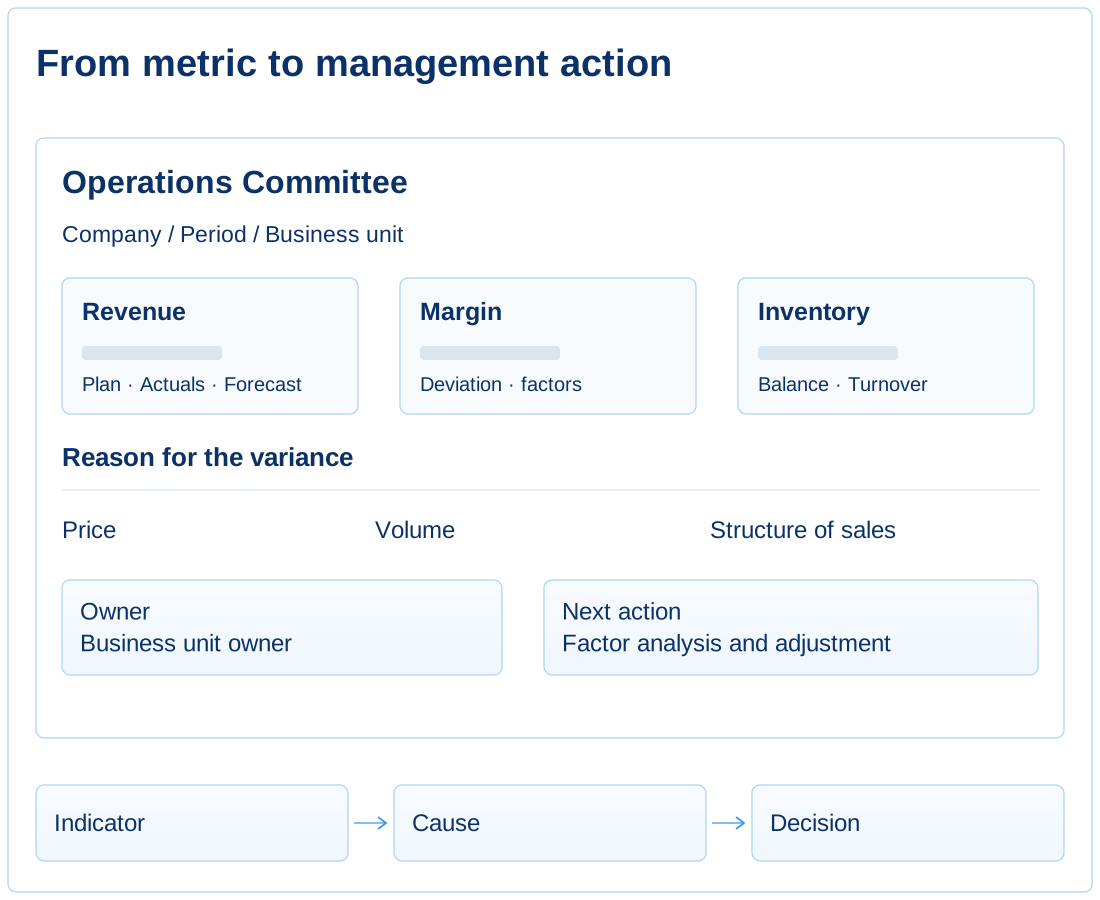
A dashboard or report follows the sequence: metric — variance — cause — owner — action.
BI demonstrates available data, but does not always support a specific decision-making cycle.
We develop analytical products for defined management questions, with detail on causes, owners and scenario views.
Managers can move from a summary metric to its cause, source transaction, owner and subsequent action.
Engagements and deliverables: from data audits and metric models to BI platforms, data warehouses, quality controls and predictive analytics.
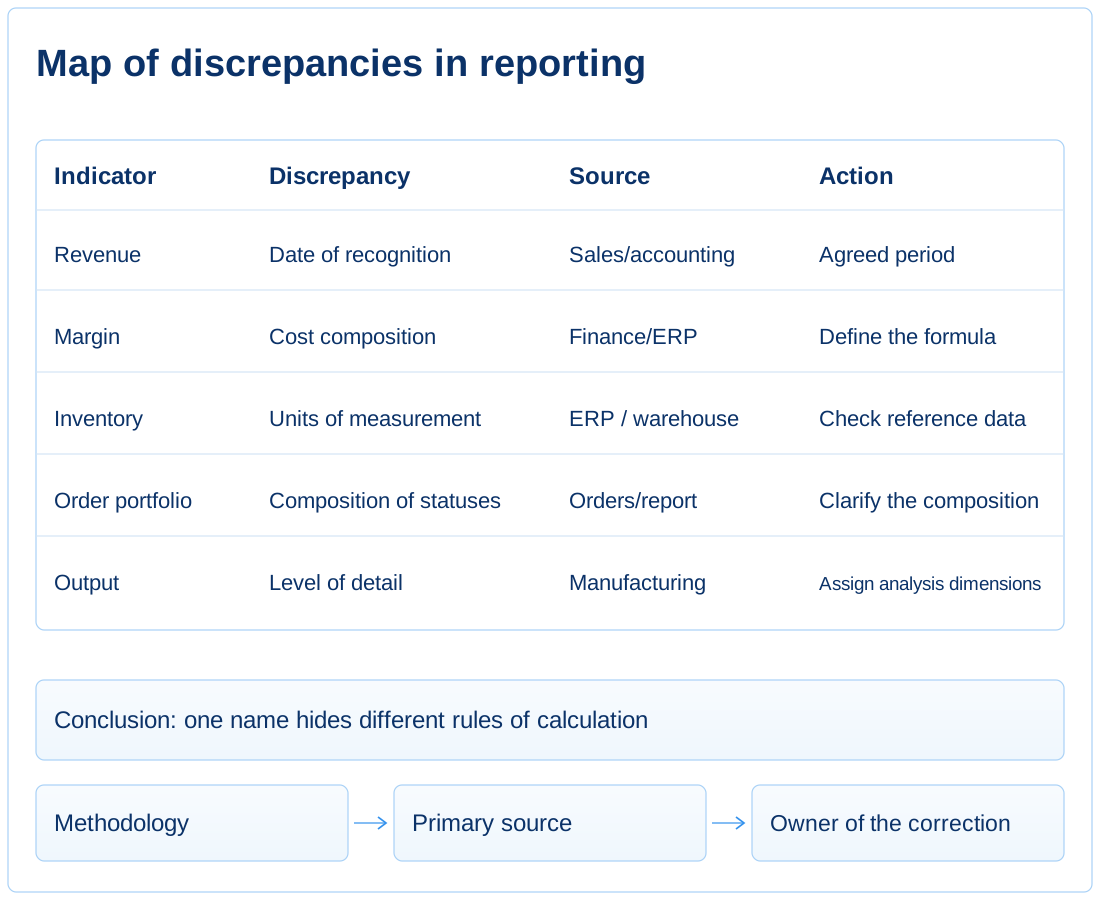
A map of discrepancies in metrics, sources, reports and manual reconciliations, showing where data conflicts, lacks ownership or prevents management decisions.
A unified system of management metrics: definitions, formulas, sources, owners, frequency, levels of detail and rules for interpreting results.
Working dashboards and reports for managers and business functions: metrics, filters, access roles, drill-down, data refresh and regular usage scenarios.
Implemented data layers for management analytics: sources, transformations, data marts, change history, quality controls and consistent calculation logic.
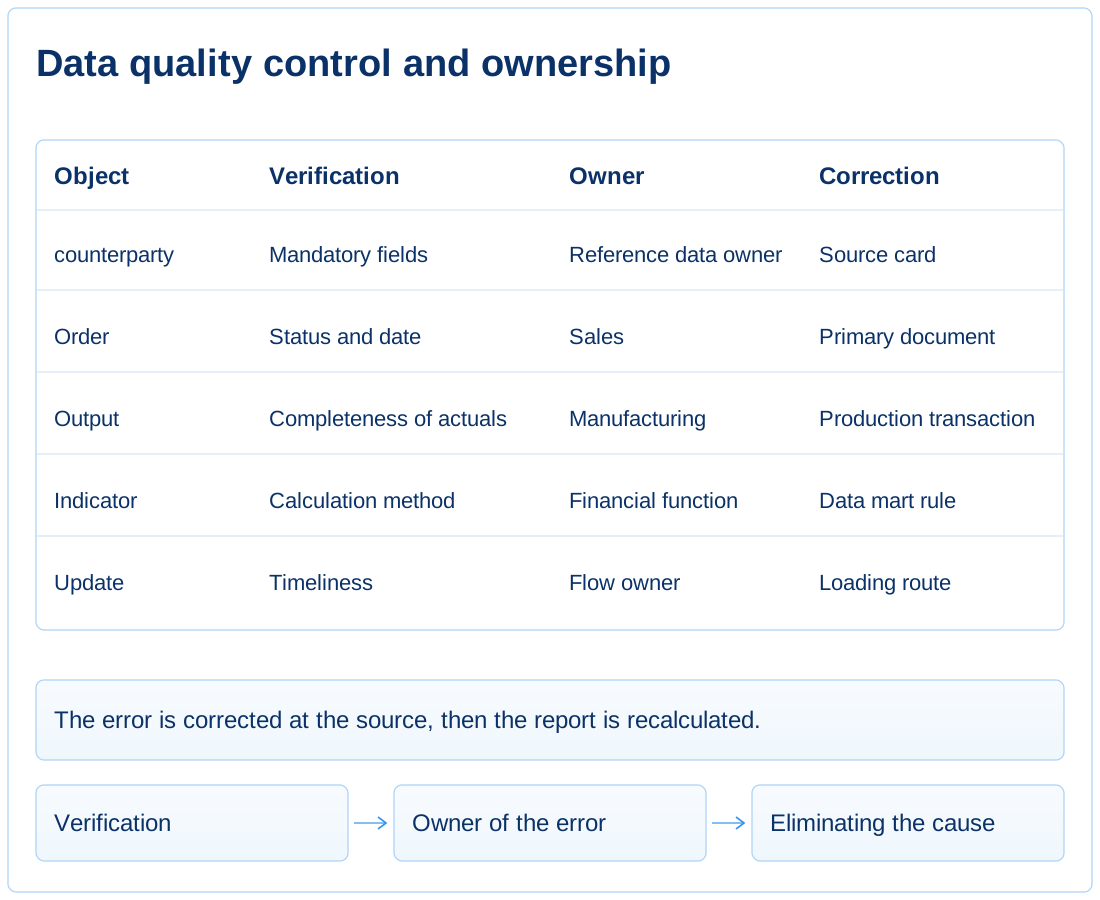
Rules for data ownership, quality control, reference data management, error resolution and accountability for metrics used in management.
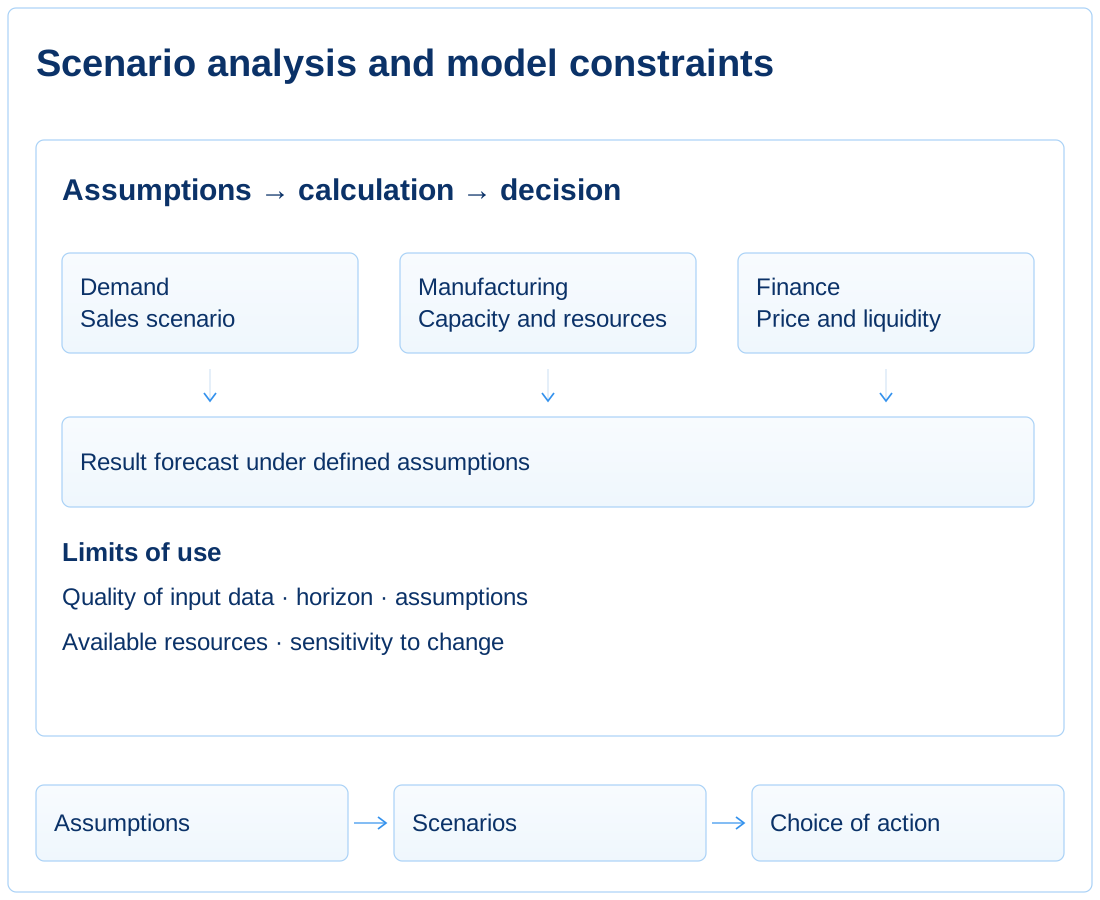
Analytical models for forecasting demand, capacity utilisation, liquidity, variances, risks and delivery dates, with clear assumptions and limits of use.
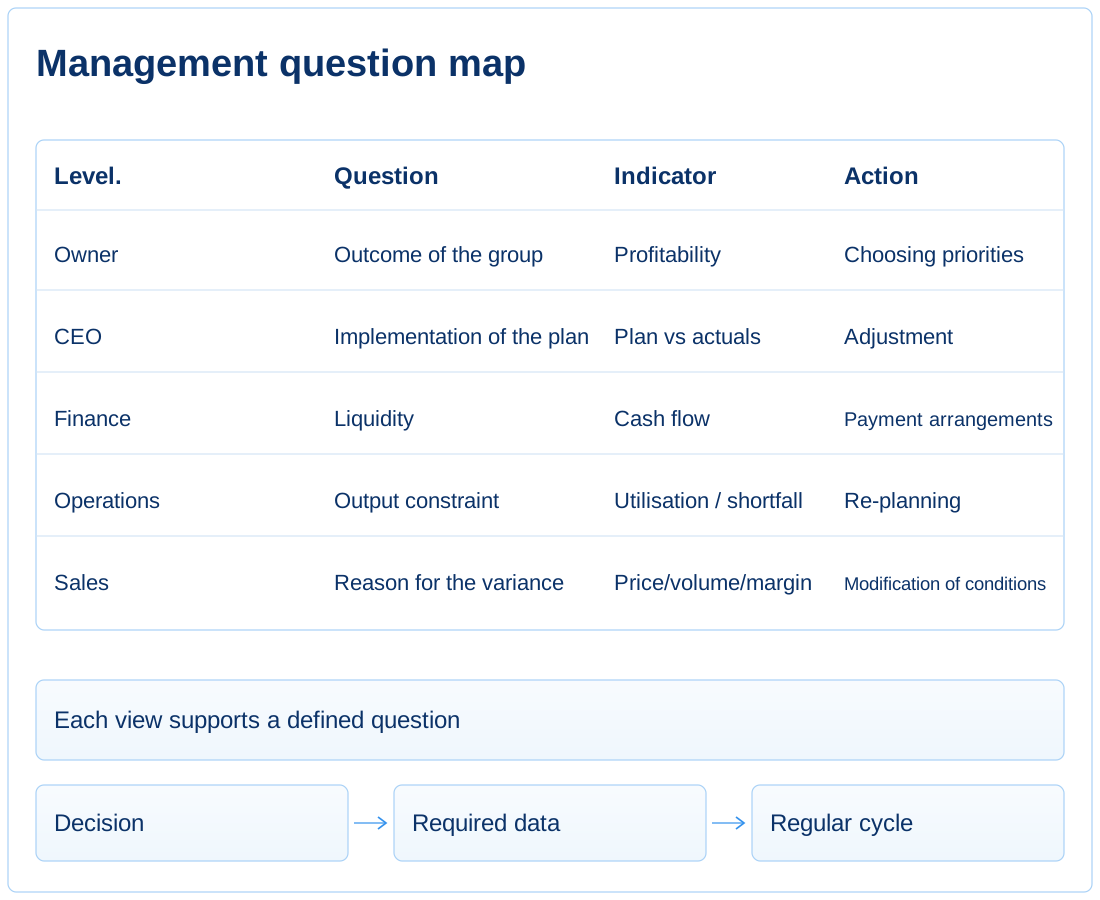
Decisions, metrics, detailing and frequency of data for the owner, board of directors and function managers.
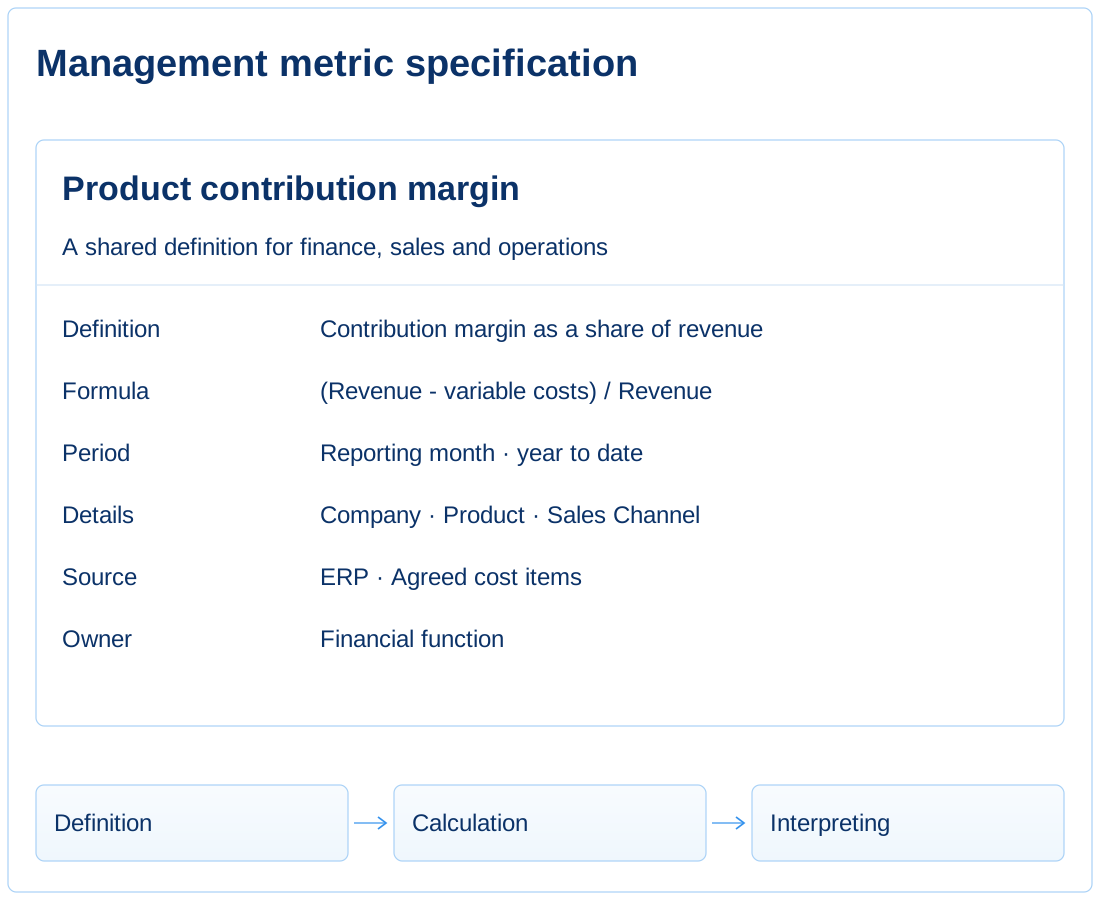
A glossary of definitions, formulas, periods, analysis dimensions, relationships and owners.
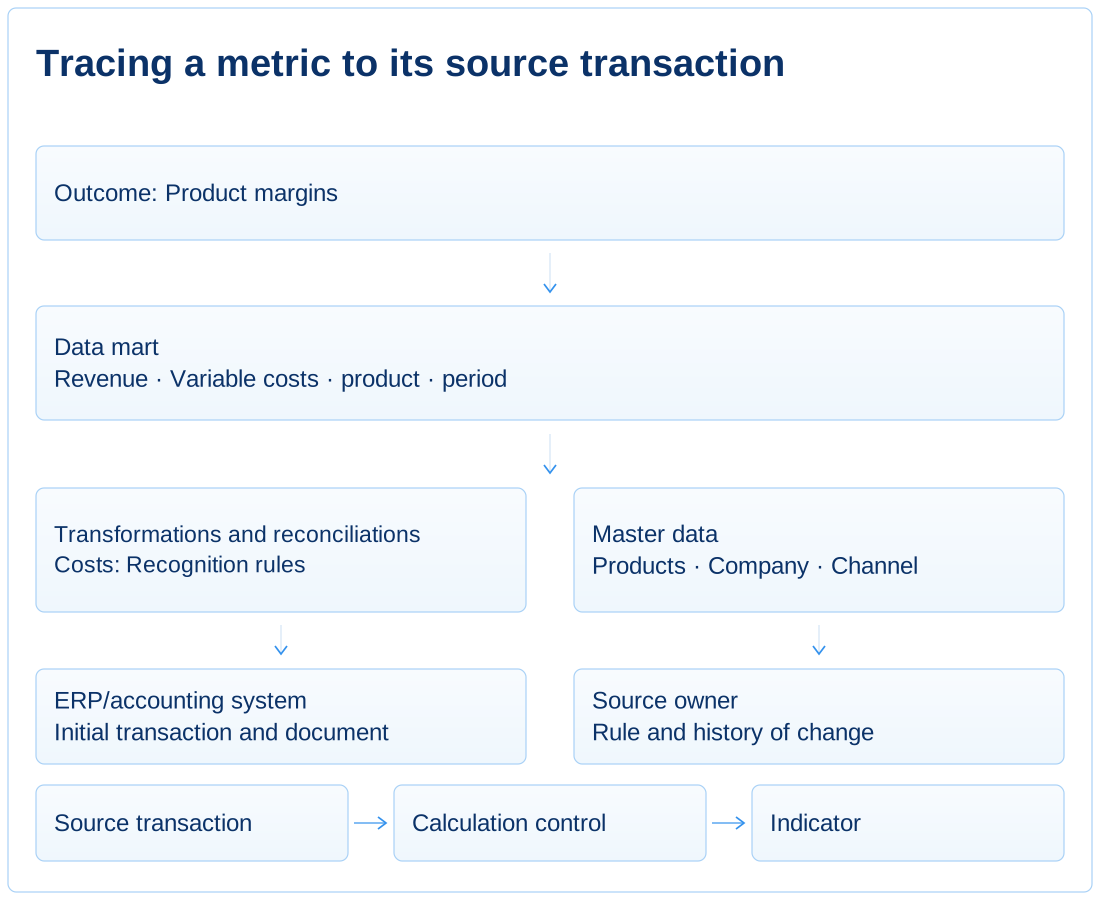
The path from the primary operation through systems, transformations and reconciliations to the final indicator.
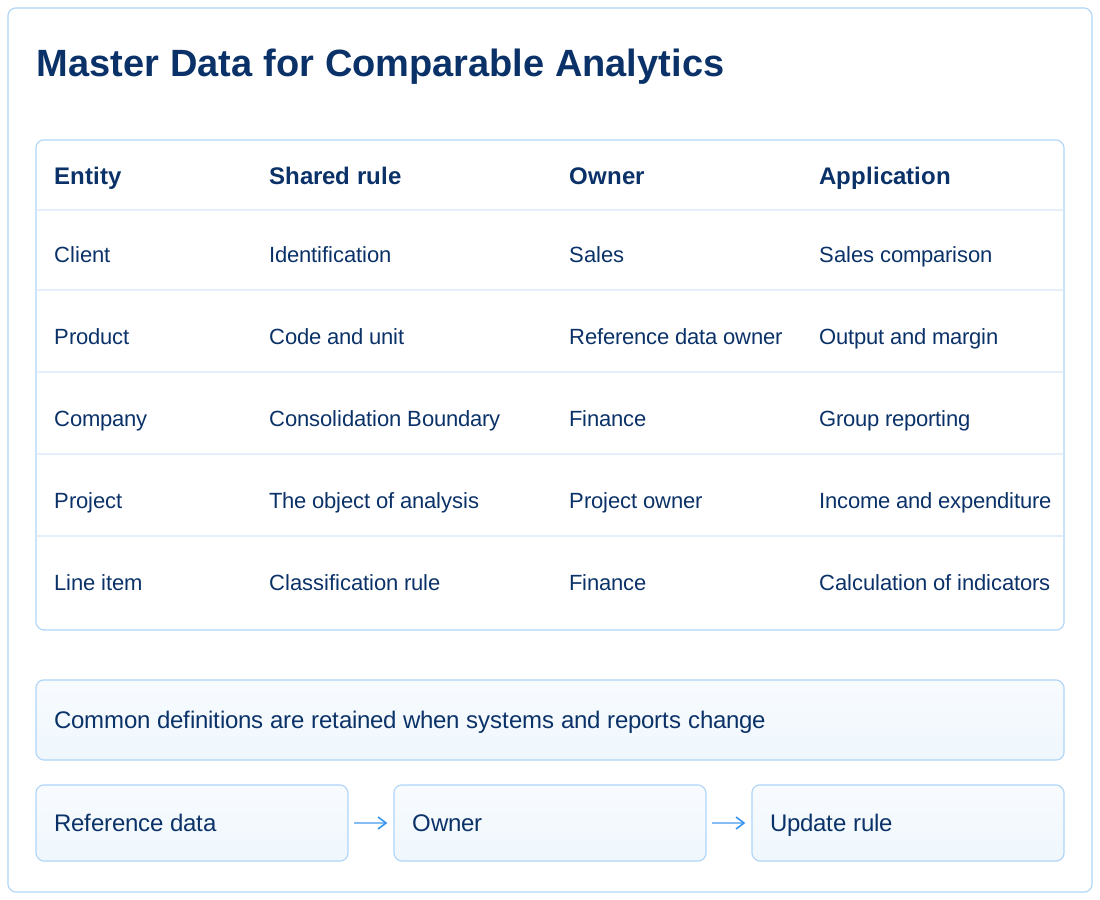
Uniform rules for customers, counterparties, materials, facilities, projects and other key entities.
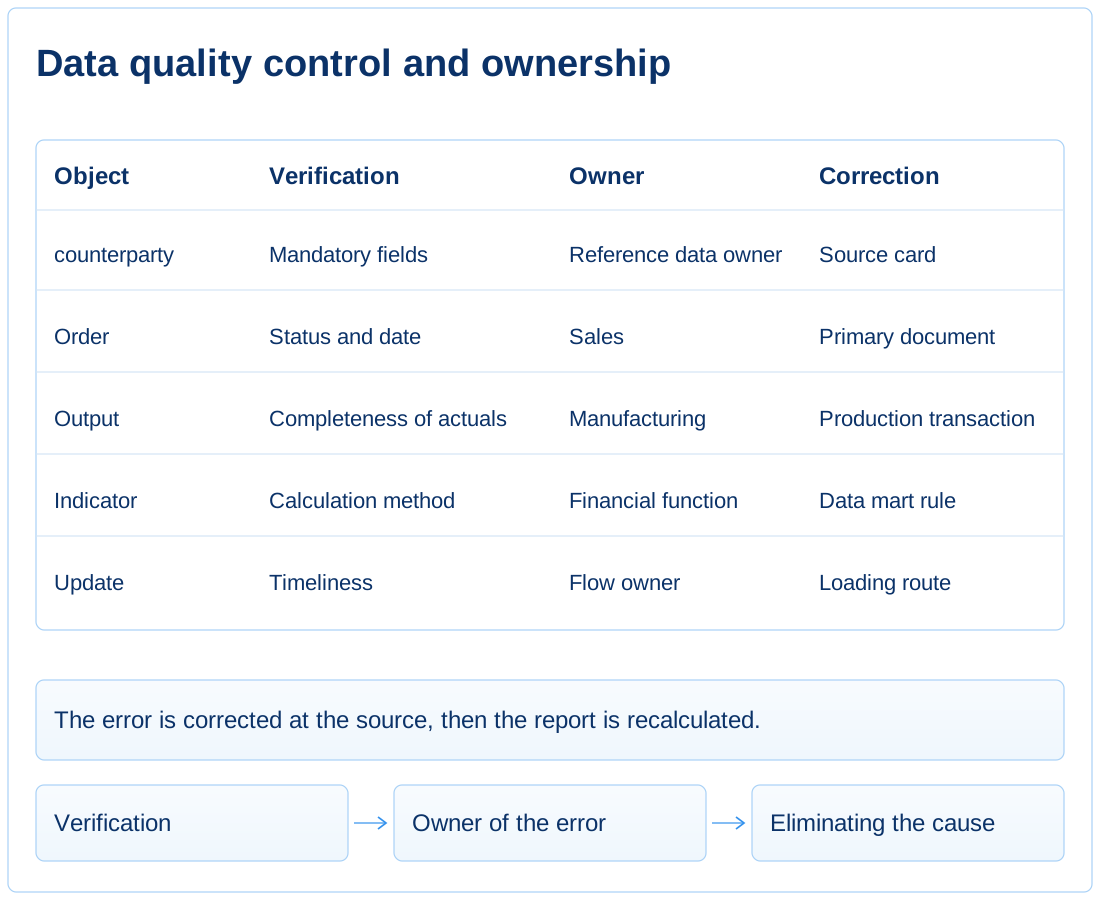
Checks of completeness, timeliness and consistency, owners of errors and deadlines for elimination.
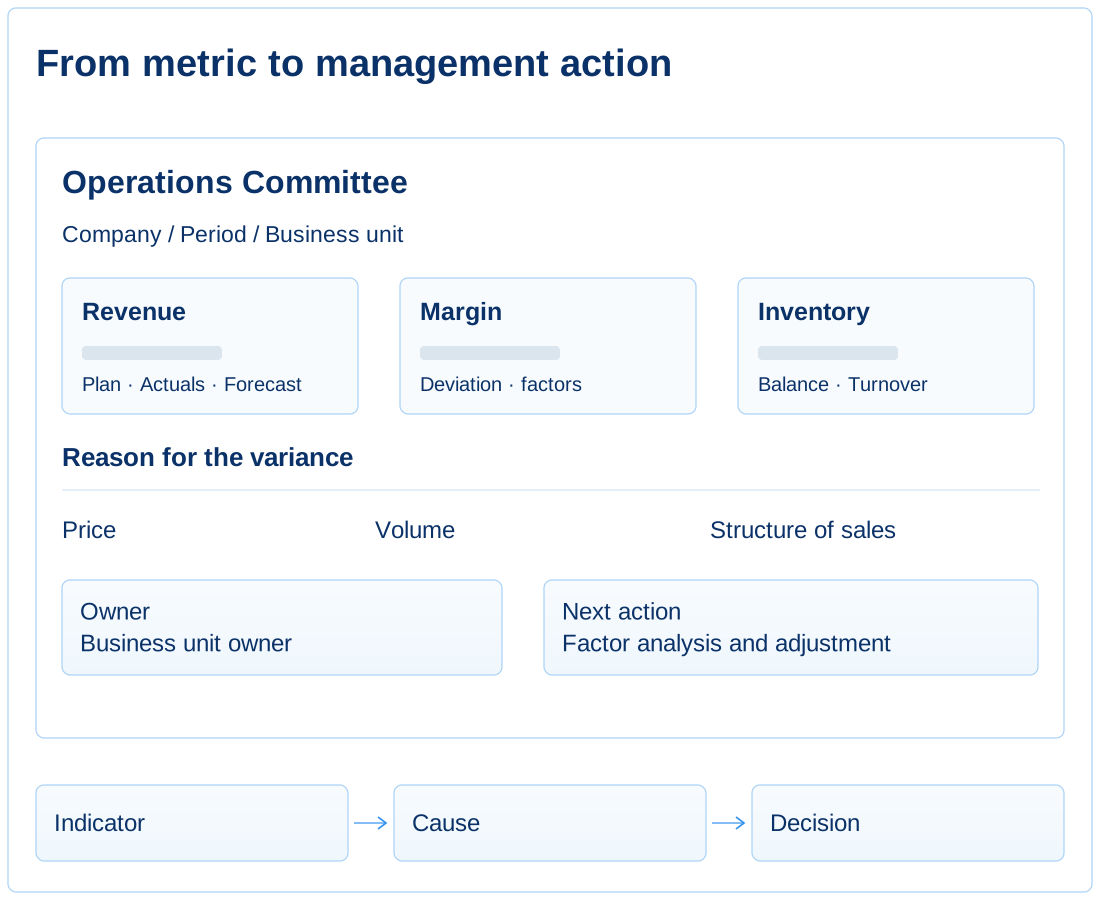
Views following the sequence: metric — variance — cause — owner — action, including predictive and scenario models.
Results are visible in the ability to reproduce a metric, trace its origins and move from a variance to its cause and a corrective action. The number of reports is not the measure of success.
One indicator is calculated using several methods, and the result depends on the unit or report.
For the indicator, a single definition, formula, period, detail and owner are fixed.
The same set of inputs reproduces the same value in all validated representations.
The final indicator is available, but the path of its formation and transformation is not obvious.
The source, transformations, reconciliations and the owner of each stage of the indicator formation are known.
From the management report, you can move to the original transaction, document or event.
Each reporting period requires manual collection, reconciliation and adjustment by employees.
Discrepancies are identified according to the rules, and the root cause is eliminated in the source system.
The preparation of regular reports does not depend on the informal actions of individual analysts.
Group companies use different reference data, statuses and metric interpretations.
Shared definitions, reference data and consolidation rules are used.
The results of the companies and sites are comparable without additional manual methodological adjustment.
New analytical models reproduce errors and discrepancies in the initial reporting.
For the data used, the meaning, origin, quality, limitations and owner are known.
The premises of the model are available to the user, and the variance of the result can be associated with the original data.
This practice is needed when data and reporting volumes grow faster than the company can agree metric definitions, sources and quality rules.