
Financial results become visible too late
Budget-to-actual analysis becomes available after the month closes, when opportunities for corrective action are already limited.
We connect revenue, costs, working capital, investment and cash flow to operational drivers, so the financial implications of current actions are visible before the period closes.
Discuss your needs →Budget-to-actual analysis becomes available after the month closes, when opportunities for corrective action are already limited.
Finance, sales, production and procurement explain the same change in margin or cash flow differently.
A positive result in P&L is not accompanied by sufficient cash flow due to inventories, receivables, payment timing or CAPEX.
The actual profitability of the contract or project becomes clear after completion, not during execution.
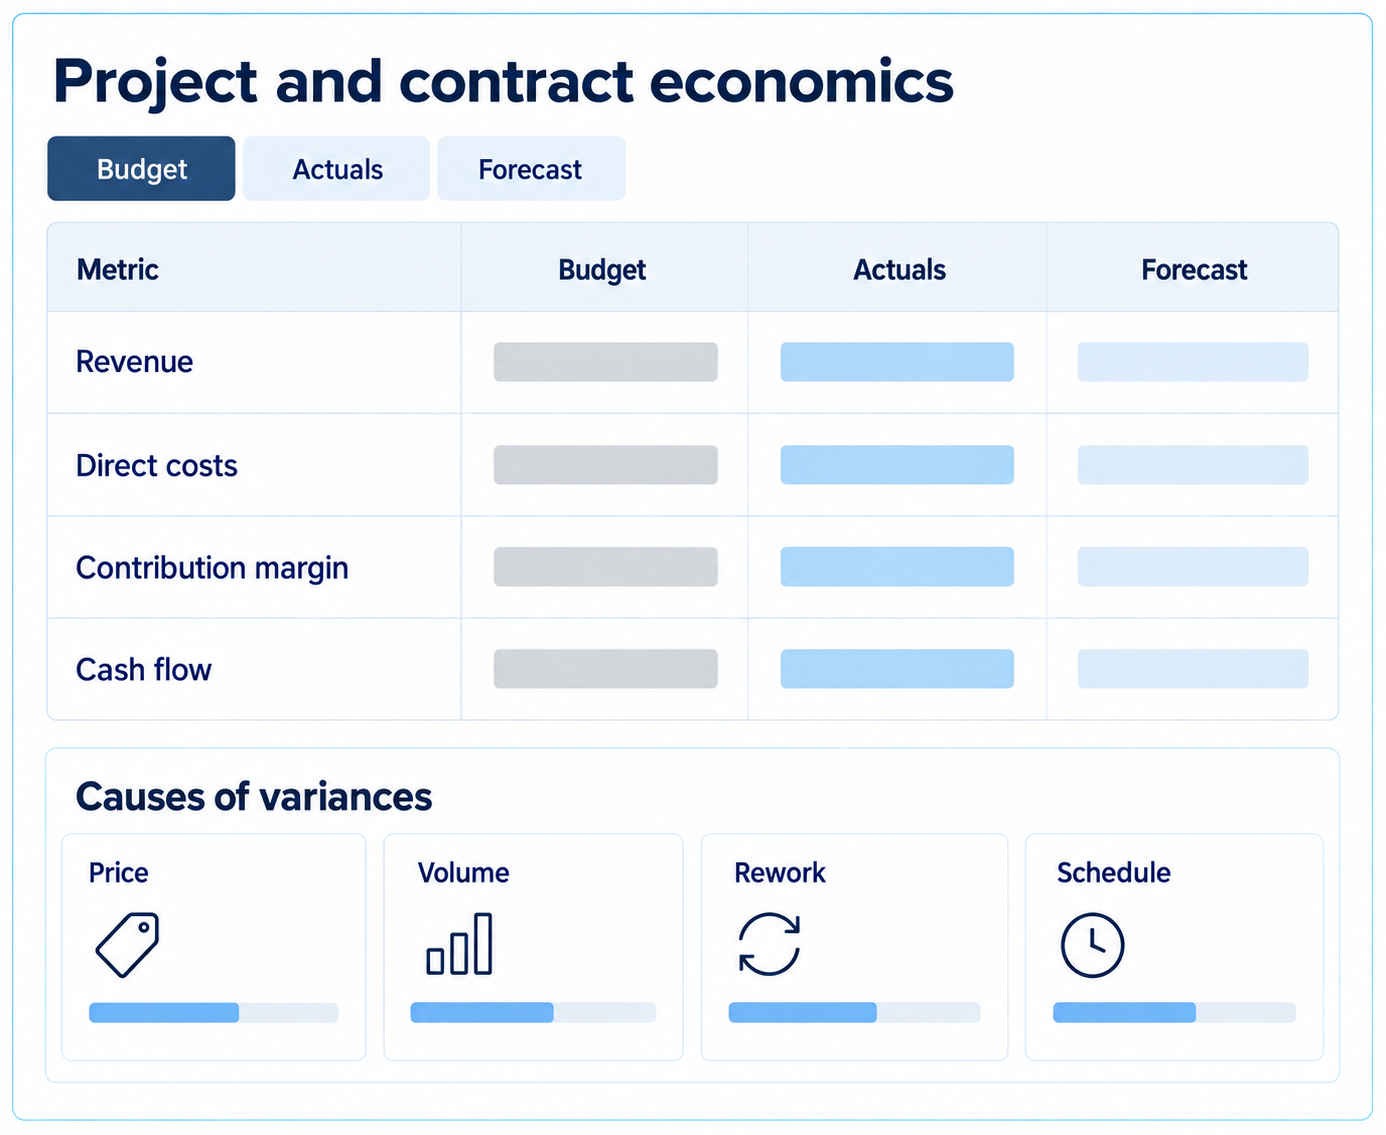
Revenue growth does not always produce sufficient cash flow. A project may appear profitable before the costs of rework, correcting non-conformities and rescheduling are included. Budget line items may be on target while the overall financial target remains unmet.
Finance, sales and production often give different explanations for the same variance at management meetings. This happens when the financial model records actuals without linking financial results to operational events.
The financial result is formed before the period closes.
If operational changes are not reflected in the forecast, financial management becomes an explanation of actuals.
Revenue, margin, costs, working capital, investment and cash flow linked to operational events.
Management objects, line items, drivers, recognition rules and plan versions.
Function, project, product and site managers whose areas generate the causes of financial variances.
Driver owners, areas of influence, analysis rules and corrective actions.
Plan, forecast, scenarios, payment calendar, management accounting and regular analysis of variances.
Calendar, versions, data sources, variance thresholds and procedures for revising assumptions.
Management finance needs to explain both what happened and why financial results are changing. Order volume, price, sales mix, capacity utilisation, delivery dates, procurement terms, project stages and turnover need to connect to the P&L, balance sheet and cash flow.
The plan defines the target, the forecast reflects the most likely outcome, and the gap between them becomes a subject of regular control. The financial model is therefore built around performance drivers, their owners and management actions.
The scope depends on the business model. Our approach is consistent: identify financial drivers, connect plans and forecasts, configure liquidity management and establish a regular cycle for handling variances.
We link financial results to the objects being managed: orders, projects, products, sites, contracts and functions.
The financial result is analysed by budget items, but the reasons for the variances are not related to operational actions.
We identify the drivers of revenue, margin, costs, working capital and cash flow, and define accounting objects, recognition rules, analytical dimensions and driver owners.
To change the financial indicator, it is clear which operational factor influenced the result and who can change the situation.
The plan sets the target, the forecast shows the most likely outcome, and scenarios define the range of possible consequences.
The budget is perceived as the only version of the future, and the forecast becomes its updated copy.
We delineate the target plan and the forecast, set the rules for revising assumptions, scenario calculation and regular updating of expectations.
When prices, volumes, timing, procurement requirements or capacity utilisation change, financial implications are visible before period close.
The payment calendar, working capital, investment and funding sources are considered within a shared framework.
Profitability in P&L is not accompanied by sufficient liquidity, and the risk of a cash gap becomes visible too late.
Link proceeds, payments, contractual obligations, receivables, inventories, CAPEX and funding sources.
The need for financing and the risk of cash gap are identified when the prerequisites change before the due date.
A variance prompts management action as well as an explanation in the report.
Budget-to-actual analysis explains the past period, but does not always lead to corrective actions.
We establish regular variance reviews: driver, financial impact, owner, corrective action and deadline.
For each significant variance, the cause, owner, timing of the adjustment and the action that falls into the management cycle are determined.
Engagements and deliverables range from budgeting models and management accounting to treasury, budget-to-actual analysis and consolidated group reporting.
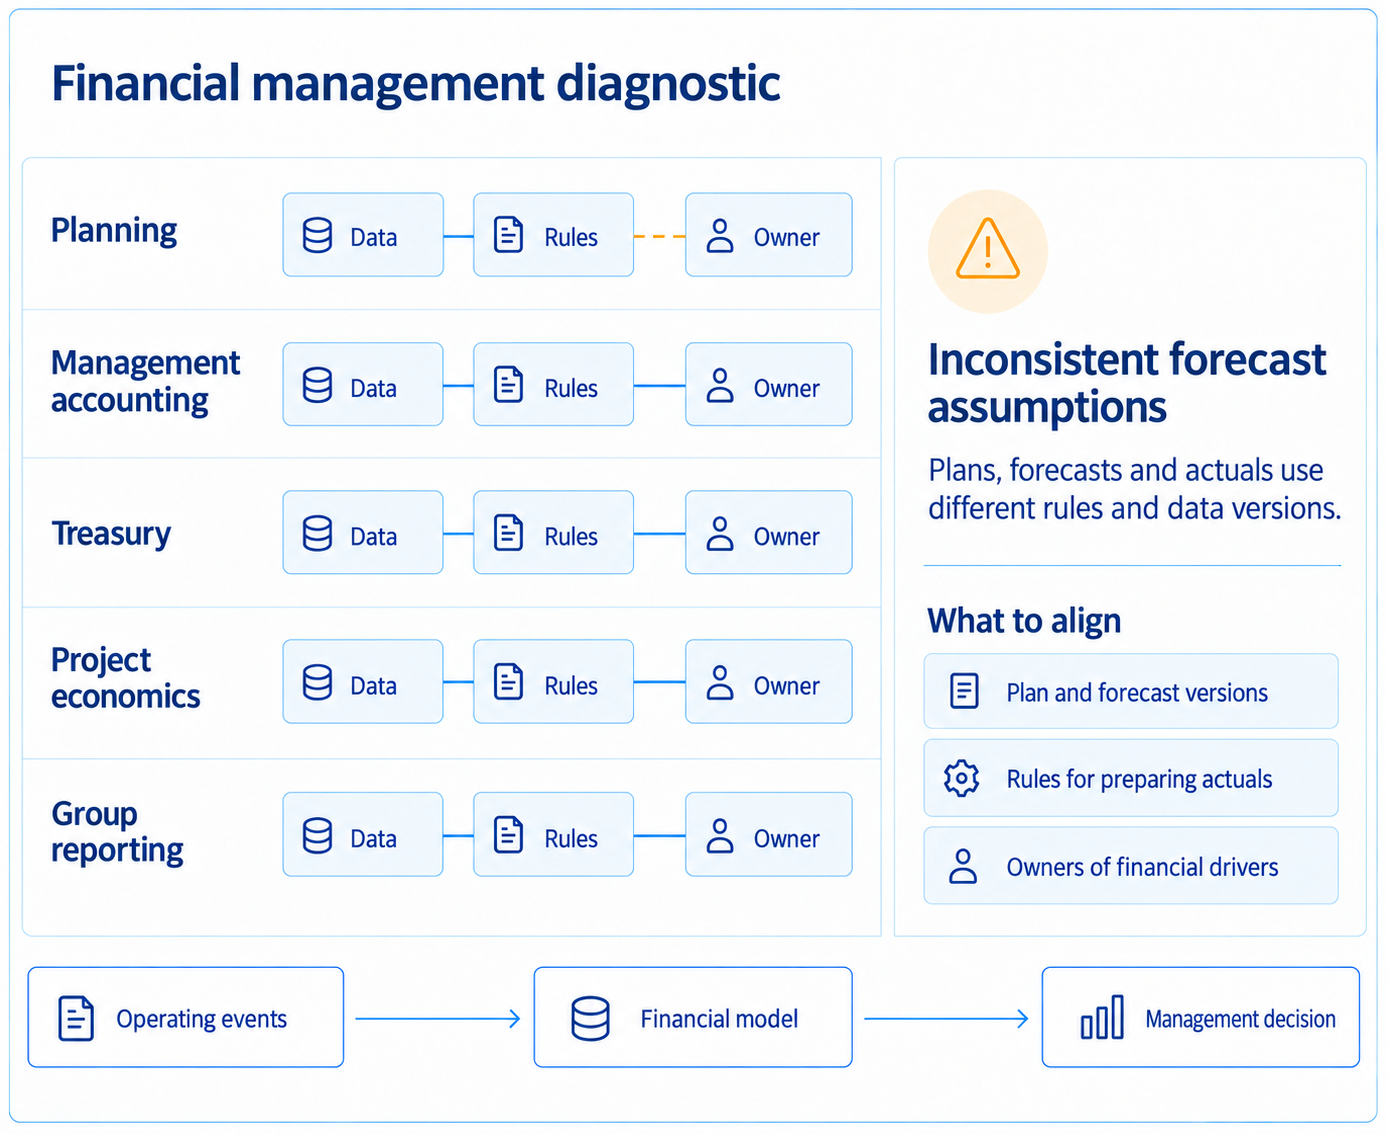
A map of financial management gaps, showing where planning, accounting, treasury, projects and management reporting diverge and fail to provide a consolidated view of performance.
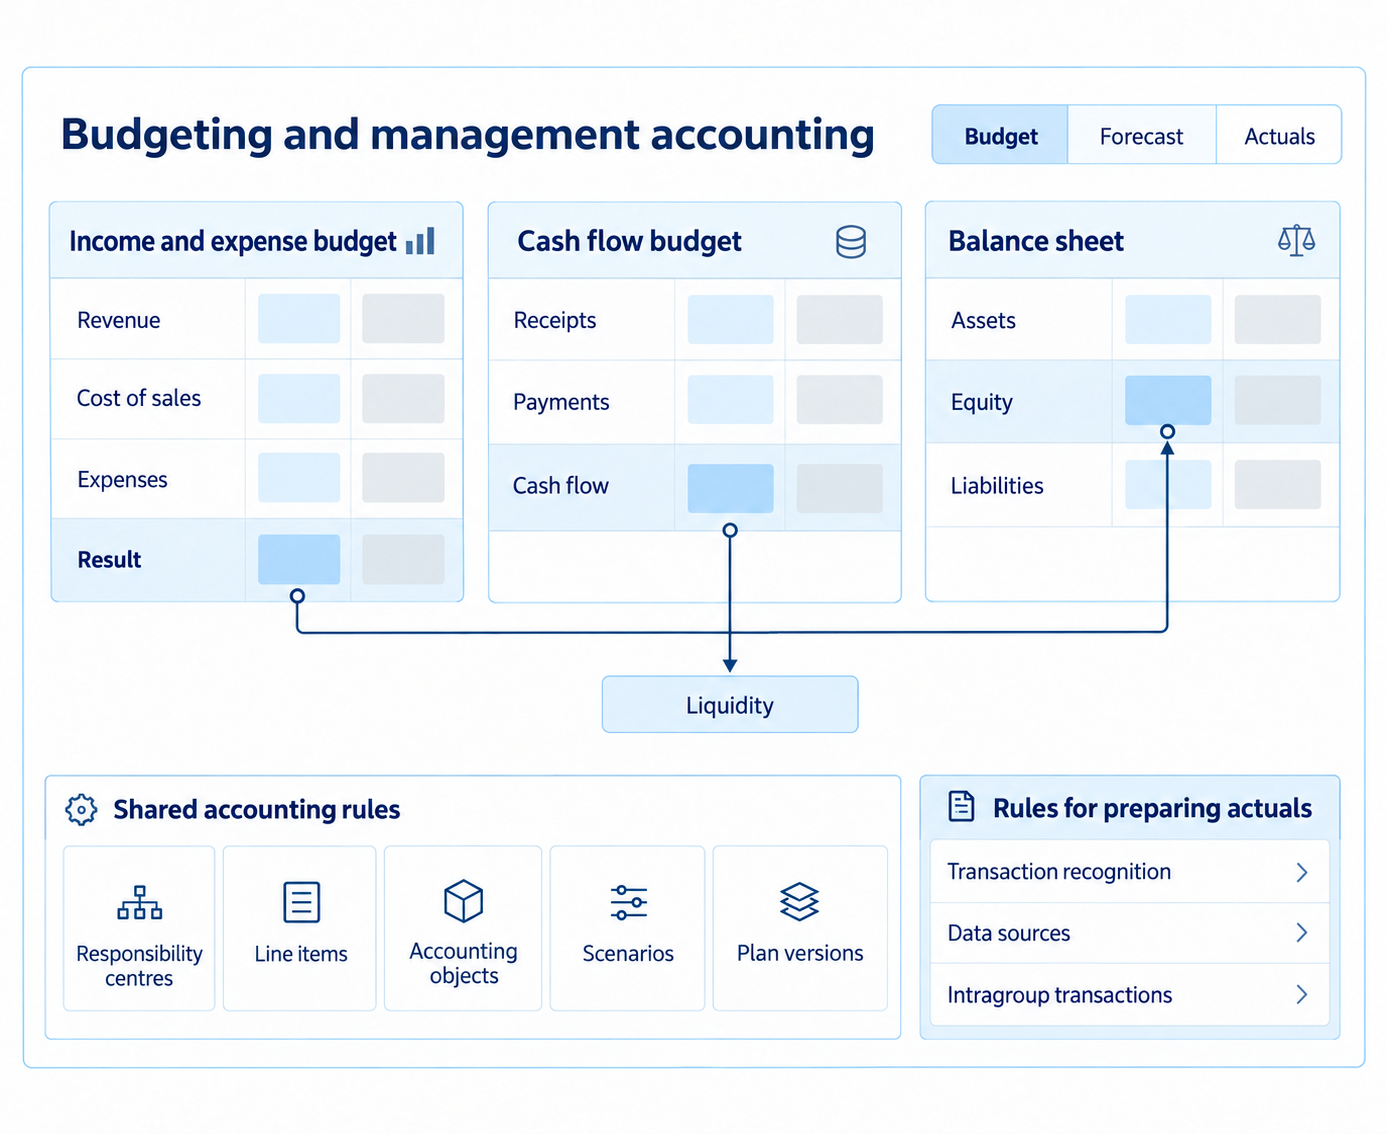
A methodology for income and expense budgets, cash flow budgets, the balance sheet, responsibility centres, line items, accounting objects, scenarios, plan versions and rules for recording management actuals.
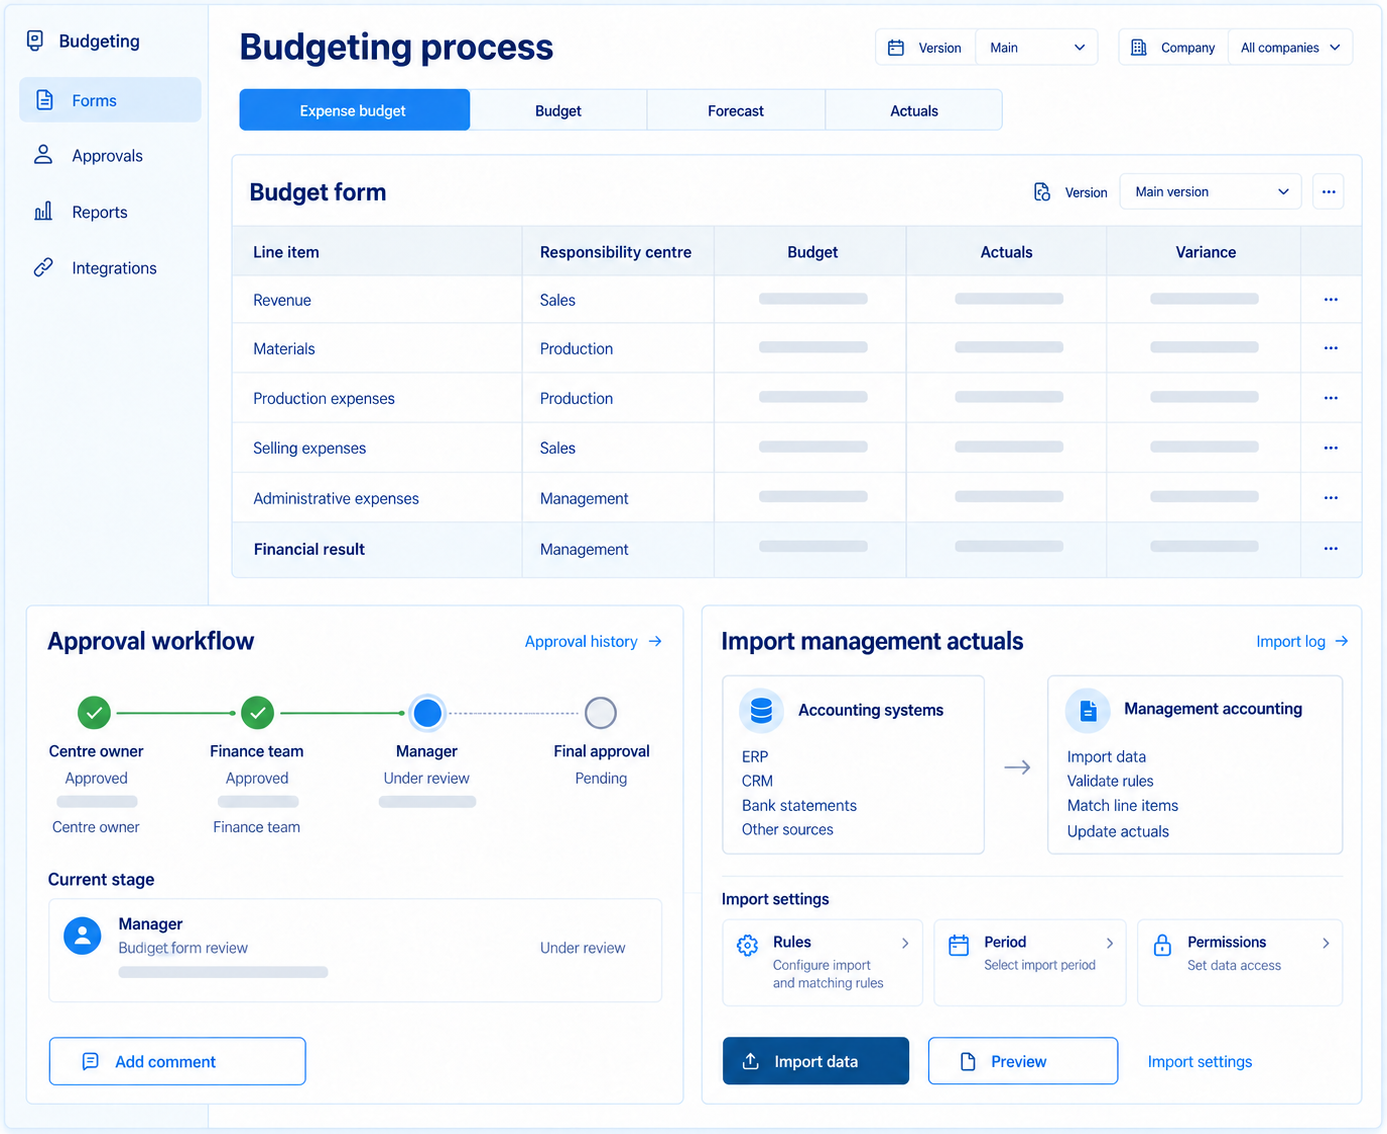
A working budgeting process: forms, approval workflows, roles, actual data imports, budget-to-actual analysis, reports, access permissions and integrations with accounting systems.
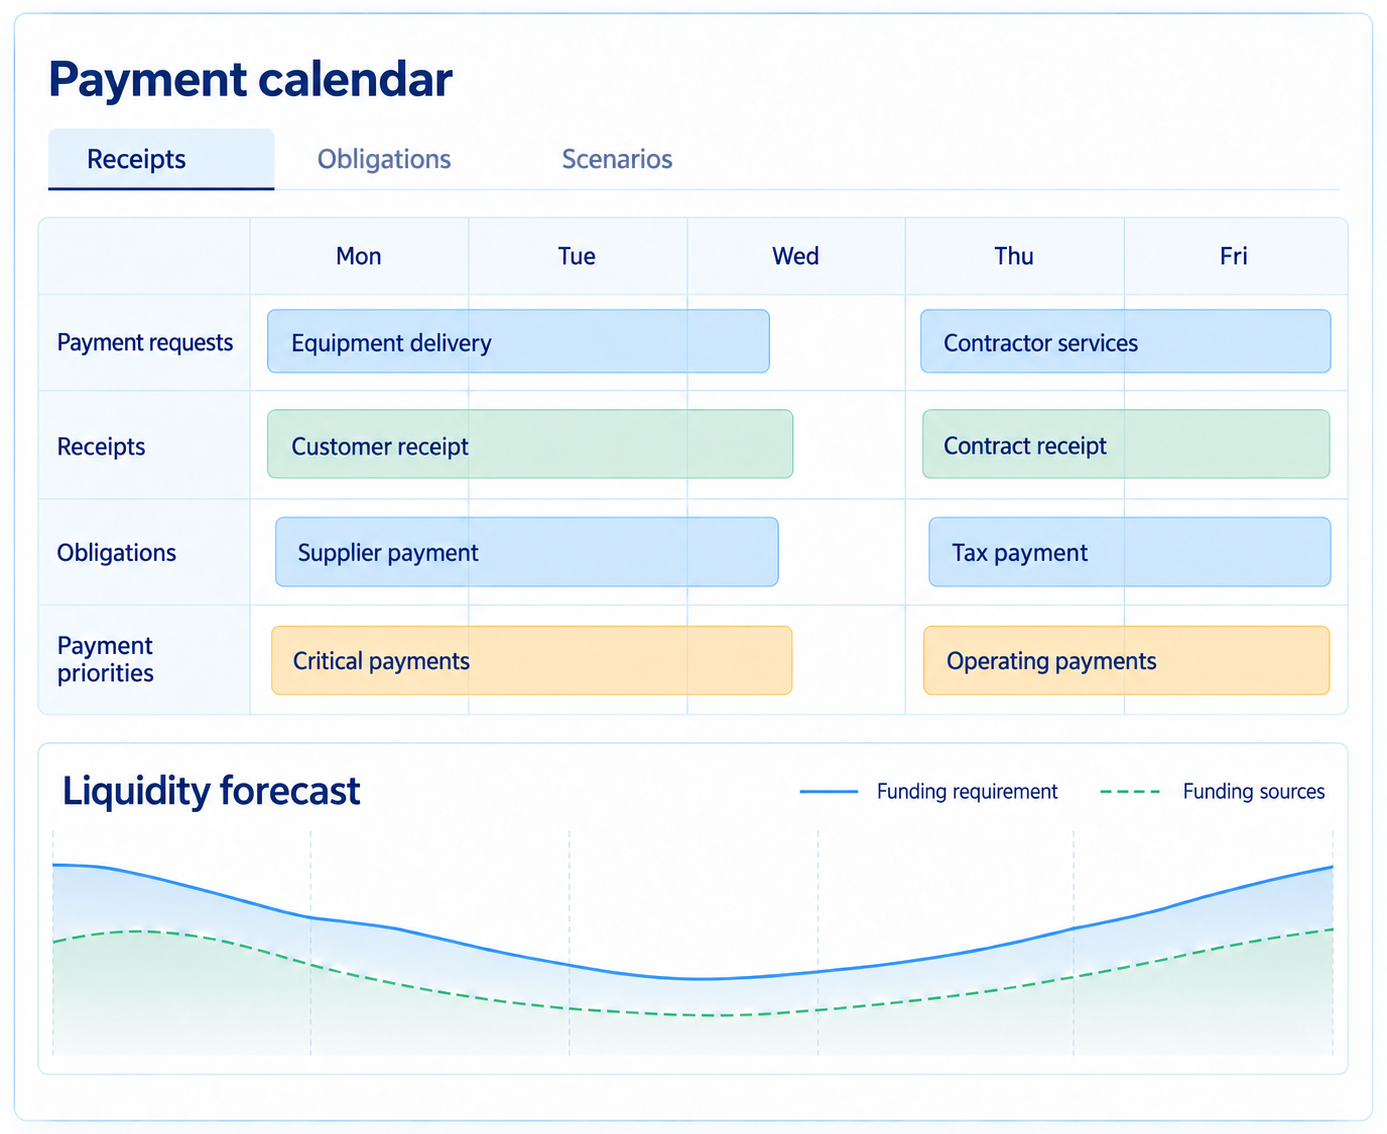
A liquidity management tool: payment calendar, payment requests, payment priorities, balances, receipts, scenarios, cash shortfalls and payment discipline controls.
A model for assessing the economics of a project, product, contract or business unit: planned and actual margins, variances, their causes and their impact on financial results.
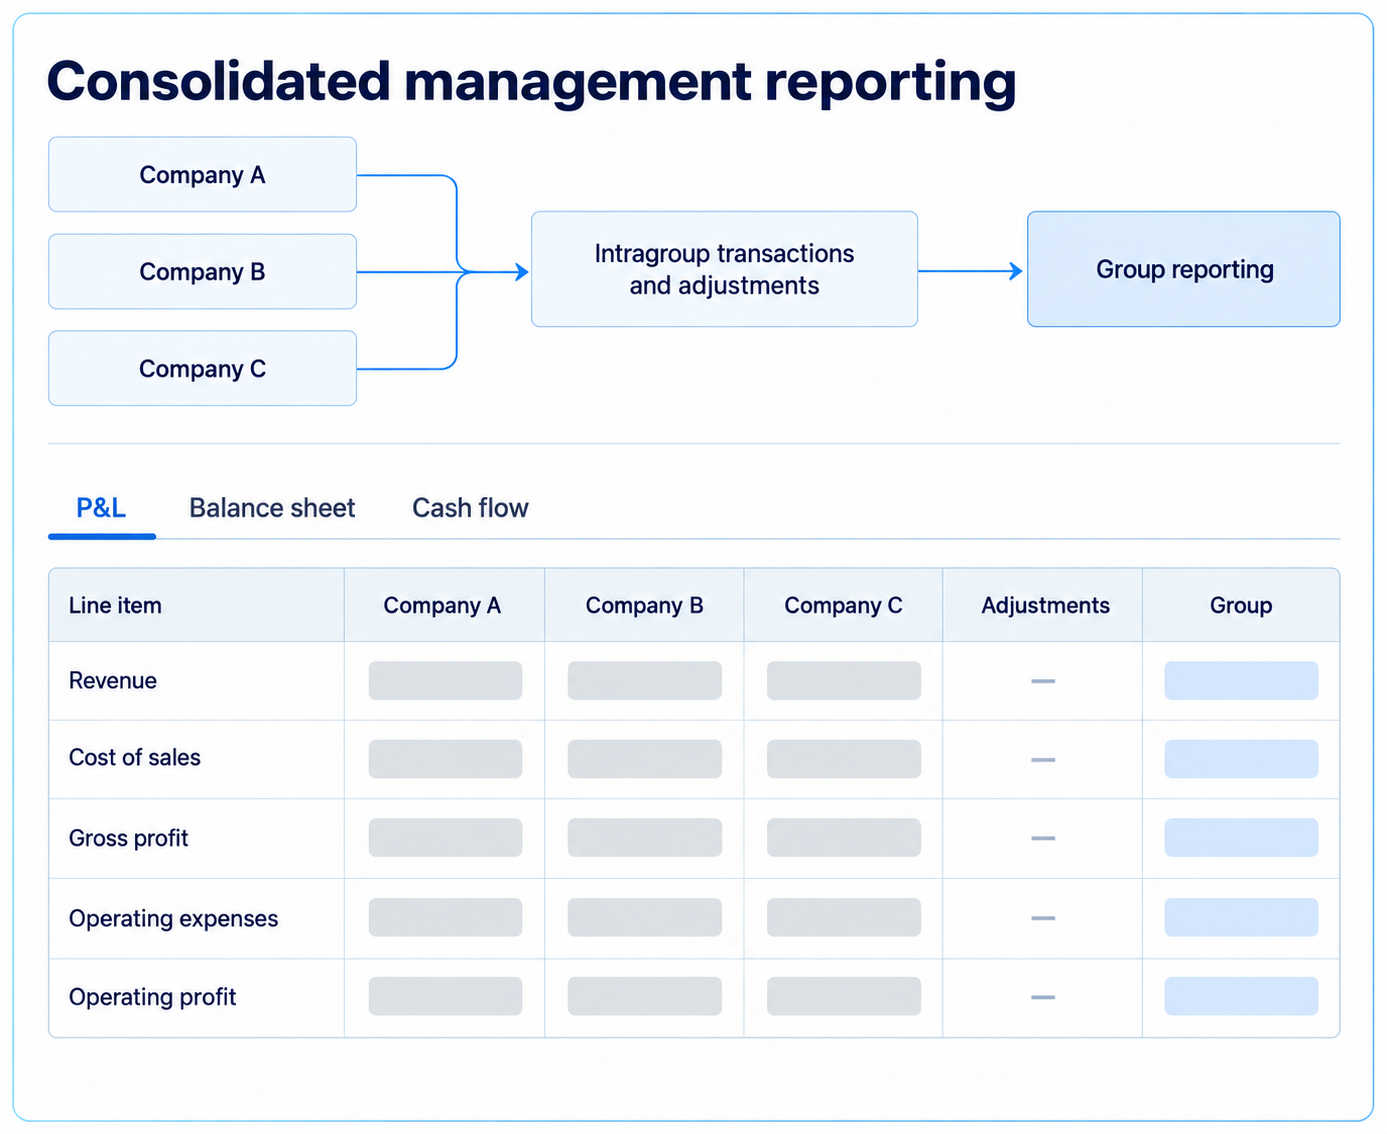
Unified management reporting across legal entities, responsibility centres, projects and business units, with rules for consolidation, adjustments, intragroup transactions and data sources.
Management objects, line items, analytical dimensions, performance drivers, recognition rules and driver owners.
A clear distinction between the target plan and the forecast, with rules for reviewing assumptions and calculating scenarios.
Receipts, commitments, payment priorities, funding sources and the liquidity forecast.
Shared rules for line items, analytical dimensions, intragroup transactions, adjustments and consolidation.
Planned and current profitability, forecast to completion, impact of deadlines and changes in the scope of work.
Factor, financial impact, owner, corrective action, deadline and execution control.
Results are visible in reporting and in the connection between an operational event, its financial impact, the driver owner and the corrective action.
Changes in timing, volumes, prices or procurement requirements appear in reporting after period close.
Changes in operating assumptions recalculate the outlook for P&L, balance sheet and cash flow during the period.
Management sees the expected financial result and range of variances before the close of the month.
The change in margin is explained by different versions of sales, production, procurement and finance.
One model traces the impact of price, sales mix, productivity, procurement, timing and costs on discrepancies.
For each significant change in margin, the factor, owner and possible corrective action are identified.
A positive result in P&L is not accompanied by sufficient cash flow, and the cash gap is detected late.
Funding needs and cash gap risk are associated with sales, supply, project and investment plans.
The payment calendar shows future liquidity deficits, sources of coverage, and owners of actions.
The reporting of the group is formed according to different rules and requires manual adjustments to each reporting date.
Line items, analytical dimensions, intragroup transactions and adjustments are defined in one methodology.
The consolidated picture is reproduced according to the general rules without separate manual preparation.
Budget-to-actual analysis captures the variance and set of explanations in the reporting.
The reason, financial impact, owner, corrective action and deadline are defined for the variance.
For each significant variance, you can see what action was taken and who is responsible for its implementation.
This practice is needed when financial results depend on operational changes but become visible only after the period closes.