

The business challenge
Group results and causes of variances
At the operations committee, managers review the month’s results, compare them with the budget and make decisions. They need data on sales, production output, inventories, costs and cash, together with the ability to trace a metric to its underlying transactions.
The first phase covers food industry businesses. KT’s task was to connect operational data and financial reporting in a model managers could use during a meeting.
Decision
Sales, production and finance in a shared model
Customer sales, production output, inventory movements and cash flows are used to calculate management metrics. A report can be filtered by period, company, customer or product to reveal the required detail.
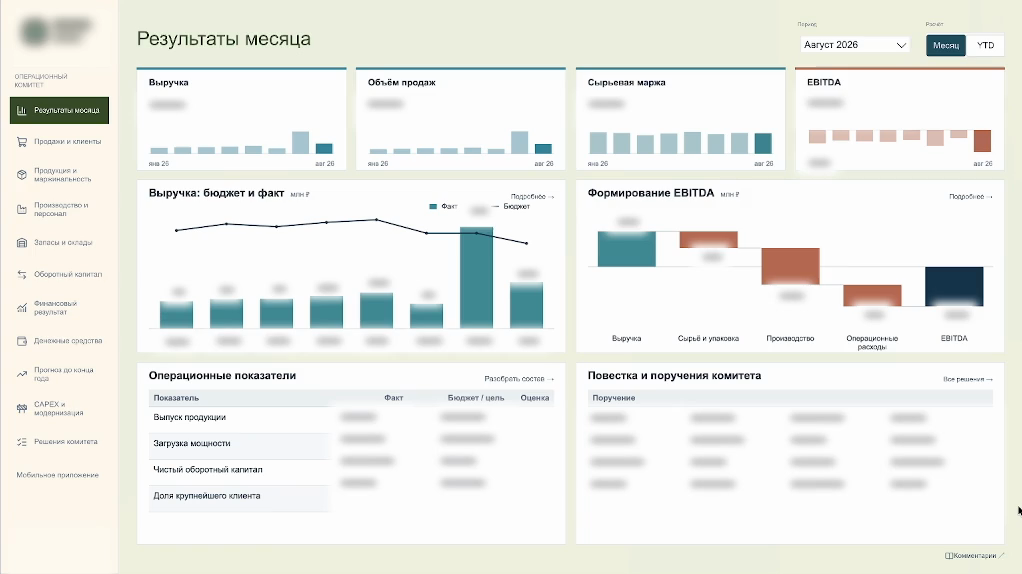
Managers compare revenue, sales volume, raw material margin and EBITDA with the budget. Customer and product analytics show their contribution to sales and raw material profitability; production and inventory sections help check how the result relates to output and stock levels.
The model contains 11 sections, including monthly results and committee decisions. Raw material profitability is presented separately from the full financial result, which includes production and other expenses.
How KT works
Think. Design. Build.
Operations committee needs
KT has determined what results managers consider, what variances need to be explained, and what detail is needed to make decisions.
Metric model and reporting structure
The team connected 1C:ERP data and financial reporting to calculated metrics. It designed the paths between monthly results, sales, products, production and finance.
Data loading and report access
KT implemented data loading, calculations and interactive pages, with access through a browser and mobile devices. During pilot use, the team checks metrics and refines the calculation methodology.
Technology and architecture
How the BI platform is built
- 1C:ERP
- Provides operational data on sales, output, inventories and cash flows.
- Financial statements
- It is used to compare operational indicators with financial results.
- Data model
- Connects sources, calculated metrics and reconciliation rules, with traceability to the transactions underlying the results.
- Power BI
- Provides interactive reporting pages, budget comparisons, and period, company, customer, or product selection.
- Web and mobile access
- Managers access reports in a browser, on a phone or tablet before a committee meeting, during it or away from the office.
In progress
Committee on 25 September
On 25 September, the operations committee reviewed August results on the BI platform instead of in PowerPoint presentations. The report brings together monthly results, budget comparisons, EBITDA metrics, operational data and committee assignments.
During the meeting, participants can drill into a metric, change the period and check the details in the report. This provides a shared basis for decisions across the group’s companies.
The pilot operation continues, and the team checks the indicators, refines the calculation rules, and agrees on the methodology.
Further development
Committee deadlines and platform development
The next task is to review the group’s operational results earlier. The plan schedules the committee reviewing September results for 15 October, and October results for 5 November. Moving to the new timetable requires timely source data, agreed calculations and an organised reporting process.
Make decisions at the beginning of the month
Operating results of the group - to the 5th day instead of the 25th.
Instead of PowerPoint presentations
Operations Committee · Decision-making
earlier decisions
following the results of the reporting month
- September · actualResults of August
- October · planThe results of September
- November · planResults of October
The timing is in the month following the reporting month, and the blue marks indicate the event, not its duration.
More data for informed decisions
Business data, external environment and knowledge of the company - in the overall management model.
New integrations and the AI assistant are planned developments. Flow widths do not represent data volumes.
The AI-ready architecture prepares data and access methods for new integrations and an AI assistant. Development includes agreeing metrics, checking data quality and setting access permissions. New sources and assistant scenarios will be tested in stages; managers retain responsibility for decisions.